Dr. Joachim Wiesemann:
Dixiplot
Services • Team • Projects • Dixiplot • Contact
Documentation | Download | Prices
Dixiplot
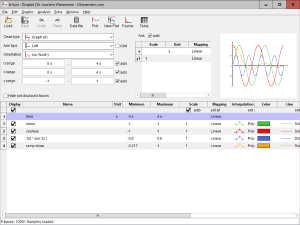
The visualization and analysis software Dixiplot is optimized for measurement and simulation data. It offers a very fast display - even of large data volumes - without skipping values. This means that even in very long recordings, a single disturbance spike can be reliably localized, regardless of the zoom level.
Dixiplot can directly read many, even proprietary file formats. For example from Matlab, Labview and various oscilloscope files.
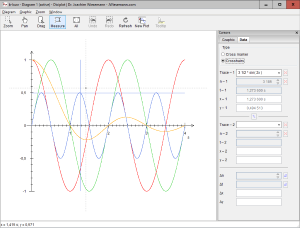
The diagram types available are time history (y/t), x/y curves and locus display. There are five different methods of interpolation for connecting the data points, five line types, 16 colours and variable line thicknesses for displaying traces.
The ability to display traces from multiple data files in a single diagram makes it very easy to e.g. compare measurement and simulation data. With various cursors, individual data points can be read out and compared very easily.
Different arrangements and orientations of axes as well as fade-in grids and boxes give a high degree of creative freedom.
Various automatic functions (for scaling traces, assigning axes, ...) generate a clear diagram even without manual intervention.
Various Fourier analysis methods are available for further analysis of the data. These also allow, for example, the analysis of non-equidistantly sampled data. And also the identification of harmonics in case of unsuitable window width.
Try for yourself: Download free demo version here.
