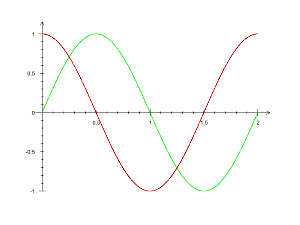
The graphics / analysis program Dixiplot is primarily used to display and analyze simulation and measurement data. These are normally available as data traces of several quantities over a common time axis. The structure of the program and the user interface are designed to give the user a quick and easy overview of these time sequences. Nevertheless, it is also possible to modify the representation of the data to a large extent and to adapt it to one's own wishes.
Dixiplot is characterized by its clear presentation and fast processing of even very large files. In addition, data from different files, e.g. from measurement and simulation, can be displayed and evaluated in one diagram. For this purpose Dixiplot can recognize and read a multitude of different file formats.
In addition, Dixiplot offers analysis options. These are primarily various possibilities for Fourier analysis. There are not only a variety of settings to adapt the Fourier analysis to the user's requirements, but also a special identification method which allows the highly accurate analysis of signals where the classical Fourier analysis fails.